Satellite Image Based Crop Type Identification

Background
Today, optical satellites observe the entire surface of the Earth at weekly intervals and measure the reflectance of sunlight at multiple spectral wavelengths. The such amassed data could be used for large scale satellite-based vegetation identification.

The identification of crop types form spaceborne imagery is an important component of agricultural monitoring. Assessing the cultivated crop types early in the season allows for estimating the expected crop yield at large scale. Such analyses at different regional or temporal scales may in future help estimate, prevent the effect of anomalous events, such as droughts, pests, and provide tools for regulatory supervision as well.
Problem Statement & Analytical Goal
Regular satellite image coverage allows for the monitoring of vegetation at discrete time intervals at spatial resolutions of 10m-60m.
The objective is to accurately classify a set of defined crop type categories in the agricultural parcels in multiple regions in Brittany, France.
Data set: The dataset comprises field parcels information in the Region of Brittany (Brétagne) France, of the season 2017, organized at a regional level by the Nomenclature des unités territoriales statistiques (NUTS). Brittany’s NUTS-2 region is further divided into the four NUTS-3 regions (Cotes-d’Armor, Finistere, Ille-et-Vilaine, Morbihan).
Data Quality Issues: positive bias by clouds caused systematically positive outliers in the image data.

Data Acquisiton & Preparation
Data Set Size: 580k+ labeled points (~35 GB)
Data Quality Issues: positive bias by clouds caused systematically positive outliers in the image data.
-
1
Each parcels' satellite data are obtained in Sentinel 2 observation logs, defined by shapefiles.
-
2
All 13 spectral bands located within one field parcel were mean aggregated into a feature vector xt, where t=timestep
-
3
Varying number of snapshots are consolidated into month-level mean-aggregated representations for each parcels.
-
4
The 12 monthly aggregated records are concatenated (flattened) into a 156-value-long feature vector which serves as (scaled and centered) input for the model.
Labels
The Common Agricultural Policy of the European Union subsidizes farmers based on the cultivated crops.
Data collection
Each member country is required to gather geographical information of geometry and cultivated crop.
Gathering
This information is obtained from the farmers themselves by surveys within the subsidy application process.
Inspection
National agencies monitor the correctness either by gathering control samples on-site or by means of remote sensing and Earth observation.
Classification
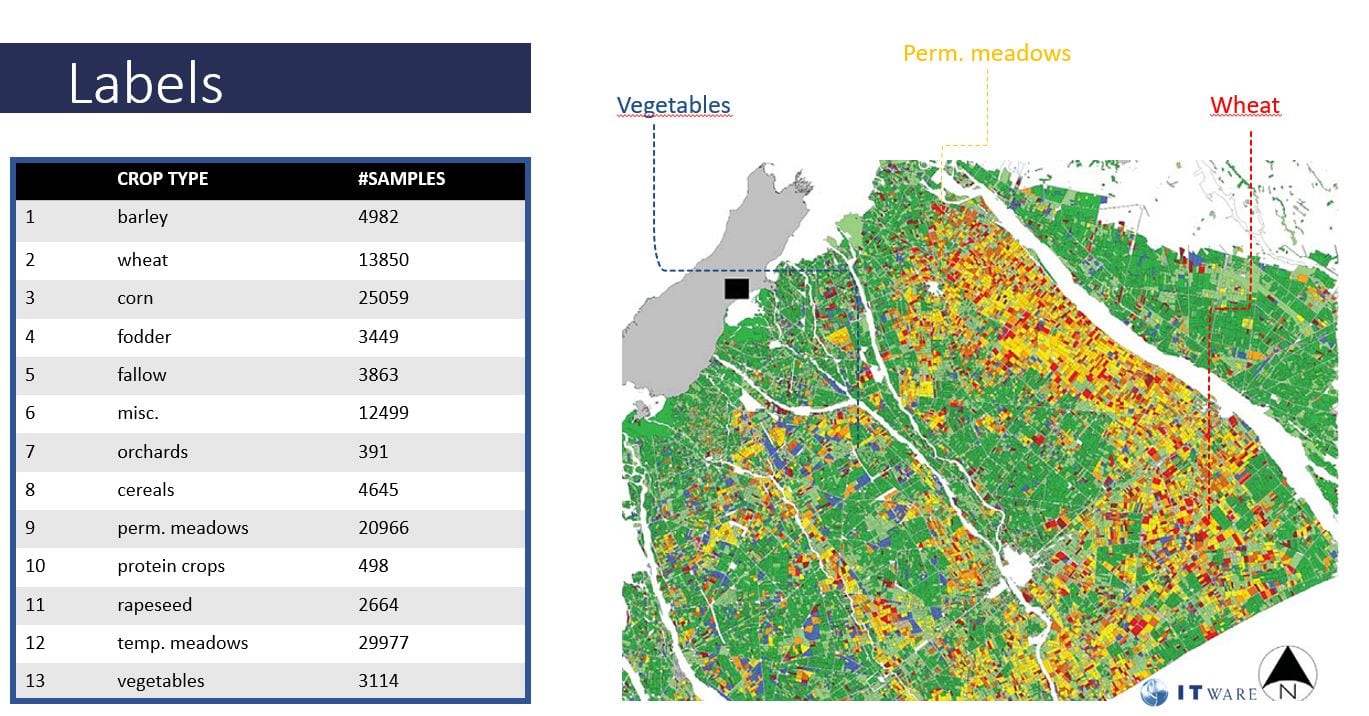
For this dataset, from the original 157 crop types are consolidated into 13 crop groups which appear at least 250 times in each NUTS-3 region.
Imbalance
Due to the fact that production focused on a few dominant crop types (corn, meadow, wheat),a class imbalance can be observed in the data.

Solution
Modeling
Dense Artificial Neural Network with Rectified Linear Units and Softmax activations, Adaptive Moment Estimation optimizer
Implementation
Python, TensorFlow

Performance
Accuracy (67%)
F1-Score(0.55)
Precision (0.62)
Recall (0.54)
Deployment
Containerized microservice (REST API)


